Report grids present data for analysis in a grid format. Grids are populated by queries built using Query Builder where the required filters and outputs to be used are defined. Data within the grids is controlled by the MiiNT Administrator.
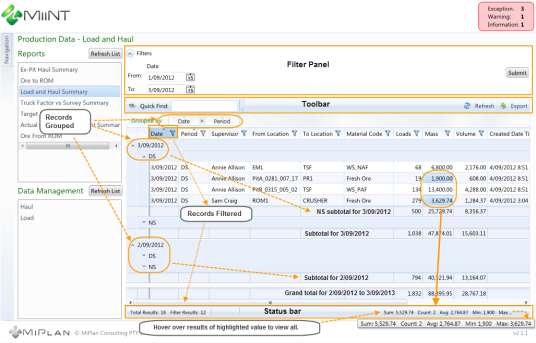
In the above report example the results from the Load and Haul Summary query have been displayed for the selected date range in a data grid. The report has been grouped by Period within Date, with additional filtering on the Date column.
The Totals row at the bottom of the data grid displays the number of records extracted, the number of filtered records and sum, count, average, minimum and maximum values for the highlighted mass values.
The following features can be used to narrow down the number of records displayed within report grids and to export the results:

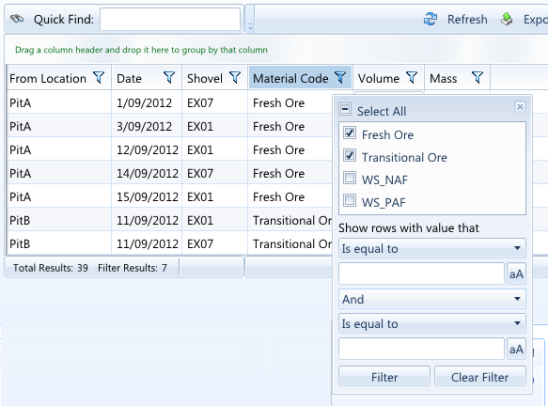
To Filter data select the Filter icon to the right of the column you wish to filter on to display the Filter options. From where there are various ways to filter the data on.
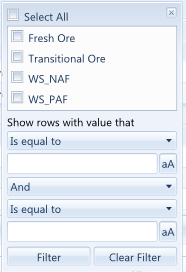
The data will be filtered as you select the required filter values and the column header will be highlighted blue.
Note: The column header is not highlighted when filtering is applied to the General Locations and Mining Locations grids.
To remove the Filter, simply select the Clear Filter button or remove previously selected filter values.
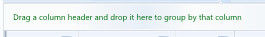
To Group data simply drag a column heading to the Grouped by area above the headings row.
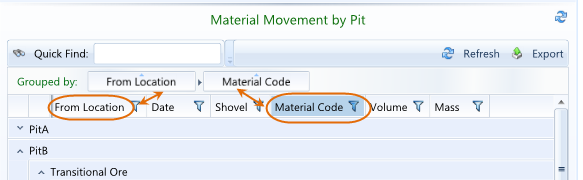
To remove the Grouping, simply drag the column heading from the Grouped by area back to the column heading area.
Note: Report queries will be automatically grouped by any groupings set within the query and the column heading(s) will be placed into the Grouped by area.
The records may be sorted into ascending or descending order by the values of the selected column. It is also possible to sort additional column values within the previously selected column values.
Click on any column heading to sort the records in ascending order by the column values. The background colour of the heading will be changed and a little triangle will appear above the column heading. Click on the column heading a second time to sort the records in descending order by the column values. Click on the Column heading a third time to remove any sorting.
After sorting the records by a column select another column whilst holding the Shift key to sort the records by the 2nd selected column within the 1st selected column.
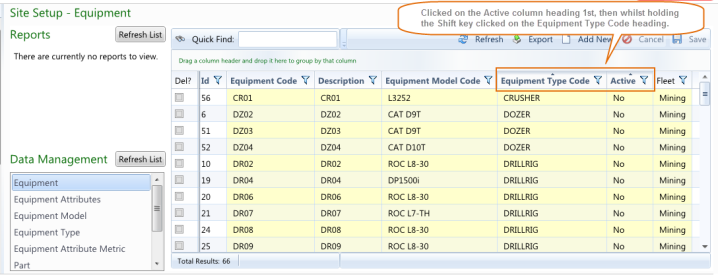
In the example above the equipment records are sorted by Equipment Type Code within the equipments Active status.
The Quick Find option can be used to quickly locate all records that contain the value that is being entered. Use the icon to clear the entered value.

It is possible to export the results in the following formats:
Note: Any filtering applied to the data grid will be reflected in the exported results.
Refer to the Report Query topic under the Navigation Menu Page Types folder for information on creating Report Queries pages.